AI Etüt Oturumu

Oturum Bilgileri

Başlangıç
02 December 2025, 05:19
Bitiş
Devam ediyor
Süre
13 dakika
Durum
Devam Ediyor

AI Öğretmen Değerlendirmesi

Tespit Edilen Eksikler

Konular:
  • Introduction to Functions and Linear Functions
Alt Konular:
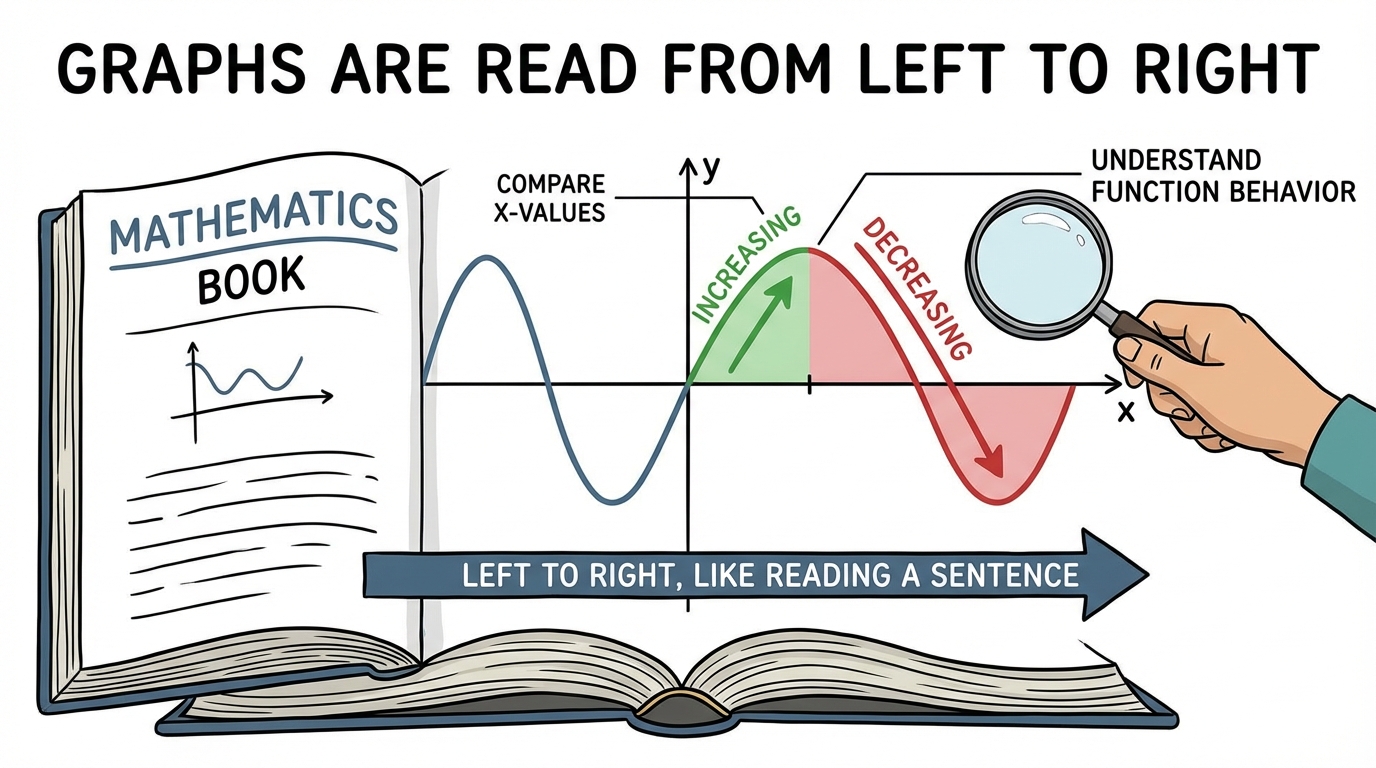
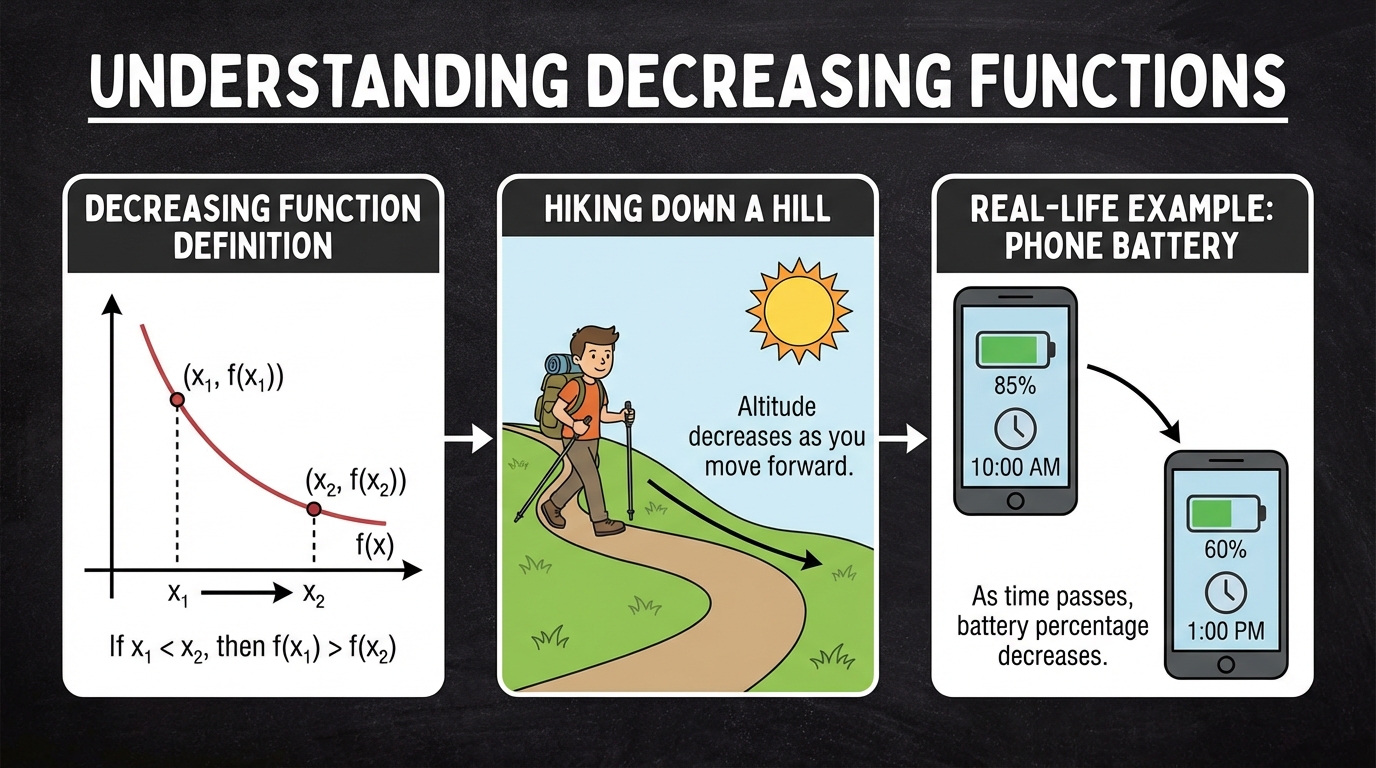
  • 2.1.c. Increasing and Decreasing Intervals of a Function

Detaylı Değerlendirme

Genel Değerlendirme

Öğrenci, dersin başında konunun detaylı anlatılmasını isteyerek derse ilgili bir başlangıç yaptı. Fonksiyonun artan ve azalan aralıklarını grafik üzerinden belirleme konusunda temel bir yetkinliğe sahip olduğu görülmektedir. Özellikle sadece artan veya sadece azalan aralıkların sorulduğu ilk iki soruyu doğru ve hızlı bir şekilde cevapladı.

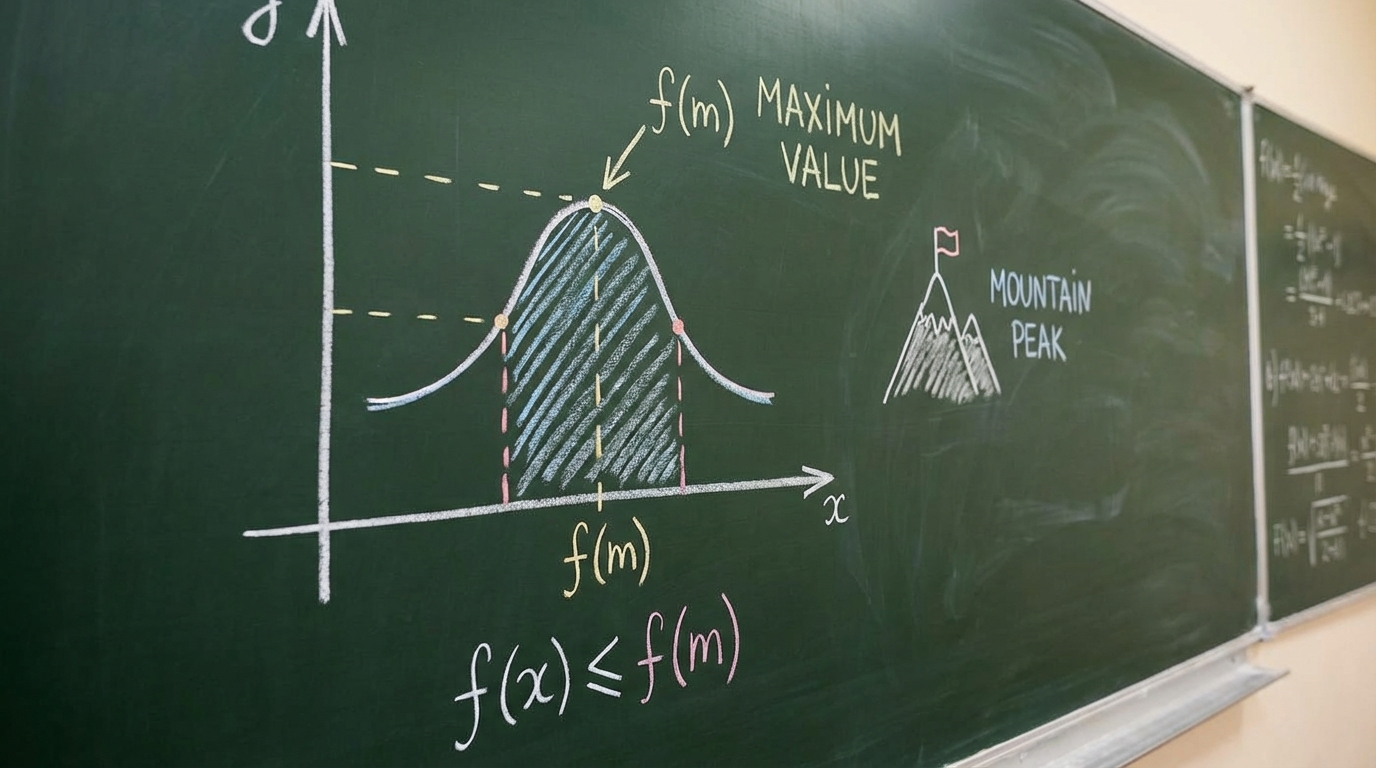
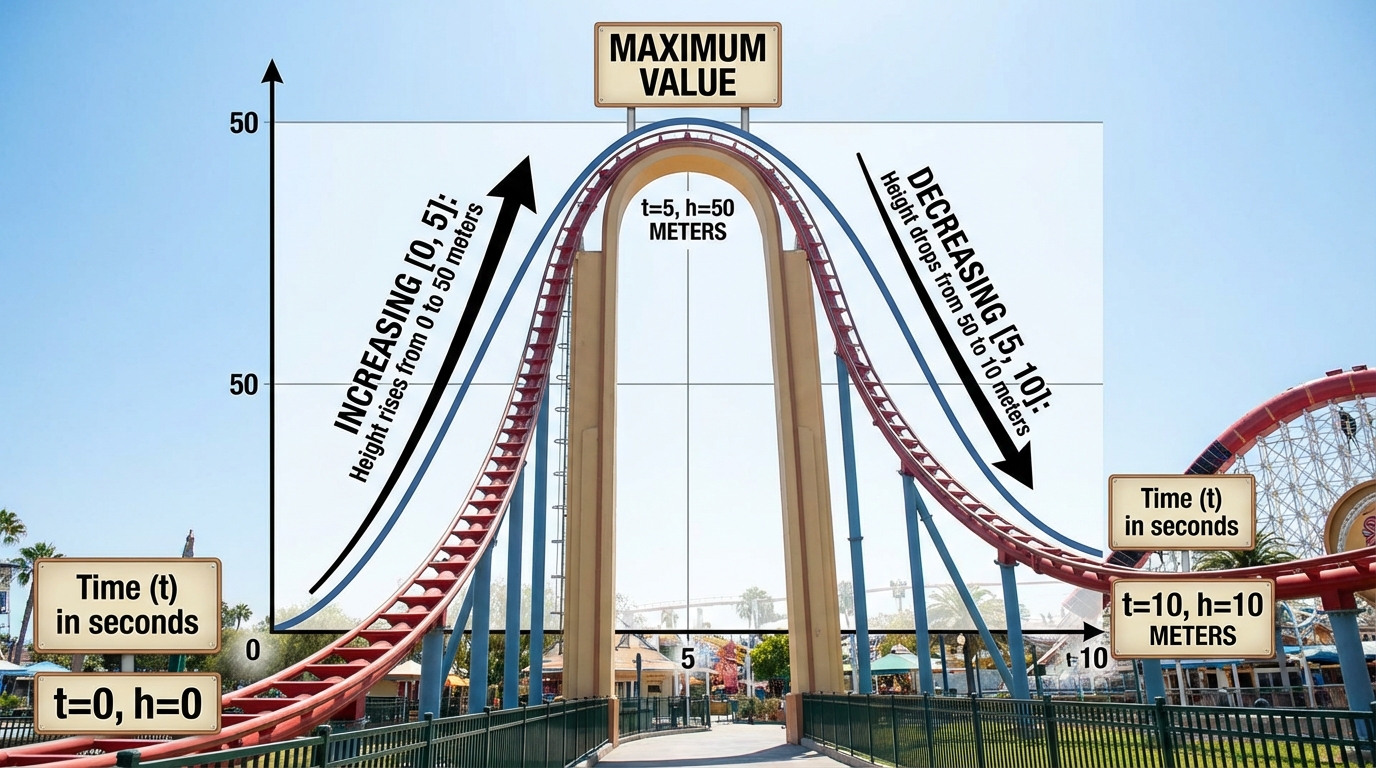
Ancak, derse "maksimum değer" gibi yeni bir kavram eklendiğinde ve sorular birden fazla bölüm içerdiğinde (hem aralıkları hem de maksimum değeri bulma) öğrencinin performansı düştü. İlk karma soruda, sorunun "maksimum değer" kısmını tamamen atlayarak sadece bildiği aralık belirleme kısmını cevapladı. Bu durum, ya soruyu dikkatli okumadığını ya da yeni kavrama adapte olmakta zorlandığını göstermektedir. Eğitmenin açıklaması sonrasında, ikinci karma soruda tüm kısımları doğru cevaplayabilmesi, konuyu öğrenebildiğini ancak ilk denemede zorlandığını ortaya koymaktadır.

Öğrencinin İyi Olduğu Konular

Öğrenci, bir fonksiyon grafiğinde artan ve azalan bölgeleri görsel olarak tespit etme konusunda başarılıdır. Bu temel beceriyi dersin başından itibaren doğru bir şekilde uygulamıştır.

Geliştirilmesi Gereken Yönler

- Çok Adımlı Sorular: Öğrenci, birden fazla bileşen içeren soruları yanıtlarken zorlanmaktadır. Sorunun tüm kısımlarını dikkatlice okuyup anladığından emin olması gerekmektedir.
-
Yeni Kavramların Entegrasyonu: Mevcut bilgisiyle yeni bir kavramı birleştirerek sorulan sorularda başlangıçta başarısız olmuştur. Yeni öğrenilen kavramları mevcut bilgiyle entegre etme alıştırmaları yapması faydalı olacaktır.

---

📜 Oturum Detayları

05:19:19
Öğrenci
Yes, I am ready! Can you explain this topic in detail?
05:19:20
💭 AI Öğretmen
Preparing the explanation now
05:19:20
Görsel
Görsel
05:19:22
AI Öğretmen
Graphs in mathematics are always read from left to right, similar to how you read an English sentence.
05:19:24
AI Öğretmen
This approach helps us understand how a function or line on a graph behaves as we move along the $x$-axis.
05:19:26
AI Öğretmen
When we look at two $x$-values, we always move from the one on the left to the one on the right to see what happens to the function.
05:19:27
AI Öğretmen
We check if the function is going up or down between these two points by moving left to right.
05:19:28
AI Öğretmen
Remembering this left-to-right direction is important, because it helps us decide where a function is increasing or decreasing.
05:19:30
AI Öğretmen
Did the explanation about reading graphs from left to right and identifying increasing or decreasing intervals make sense to you?
05:20:03
Öğrenci
I got it
05:20:07
💭 AI Öğretmen
Excellent, moving forward
05:20:07
🎥 Video
05:20:08
AI Öğretmen
Did you understand how to identify an increasing interval on a graph?
05:22:25
Öğrenci
I got it
05:22:28
💭 AI Öğretmen
Let us proceed now
05:22:28
❓ Soru basic
![Figure](https://pajxpzsolirfrzhpksii.supabase.co/storage/v1/object/public/question-images/question_33e16c0c-dc3a-47bd-91c9-e1d47eecd95c.png) Example: The graph of f is shown on the below. Find the intervals of x for which f(x) is **increasing**.
05:23:07
Öğrenci
My answer is: from -5 to -2, from 0 to 3
05:23:08
💭 AI Öğretmen
Noted your intervals
05:23:12
AI Öğretmen
Fantastic job! You've correctly identified the intervals where the function is increasing.
05:23:14
AI Öğretmen
You're spot on because an increasing function means that as you move from left to right on the graph, the y-values are going up.
05:23:15
AI Öğretmen
You clearly understood how to visually interpret the graph and pinpoint those upward trends. Keep up the great work!
05:23:16
AI Öğretmen
Therefore, the correct answer is from -5 to -2 and from 0 to 3.
05:23:16
AI Öğretmen
Should we continue with the lecture?
05:23:47
Öğrenci
Alright, let's continue
05:23:48
💭 AI Öğretmen
Very well, proceeding now
05:23:55
Görsel
Görsel
05:23:58
AI Öğretmen
A function is called decreasing on an interval if, whenever you choose two numbers $x_1$ and $x_2$ with $x_1 < x_2$ in that interval, the function's value at $x_1$ is greater than its value at $x_2$, so $f(x_1) > f(x_2)$.
05:23:59
AI Öğretmen
You can think about it like walking down a hill; as you move forward, you get lower and lower.
05:24:02
AI Öğretmen
Another example is your phone's battery during the day: as time passes, the percentage goes down, showing a real-life decreasing function.
05:24:03
AI Öğretmen
Does it make sense how a function decreases over an interval, like going downhill or your phone battery draining?
05:24:40
Öğrenci
I got it
05:24:42
💭 AI Öğretmen
Let us explore this further
05:24:42
❓ Soru basic
![Figure](https://pajxpzsolirfrzhpksii.supabase.co/storage/v1/object/public/question-images/question_fb69fa74-e294-4d91-a021-e549025bd3c4.png) Example: The graph of $f$ is shown on the above. Find the intervals of $x$ for which $f(x)$ is **decreasing**.
05:25:16
Öğrenci
My answer is: from -2 to 0
05:25:17
💭 AI Öğretmen
Reviewing your answer now
05:25:22
AI Öğretmen
That's absolutely right! Fantastic job!
05:25:23
AI Öğretmen
You correctly identified that the function is decreasing when its graph goes downwards as you move from left to right.
05:25:23
AI Öğretmen
This shows you have a great understanding of how to interpret function behavior from a graph. Keep up the excellent work!
05:25:25
AI Öğretmen
Therefore the correct answer is [-2, 0]
05:25:26
AI Öğretmen
Should we continue with the lecture?
05:26:30
Öğrenci
Alright, let's continue
05:26:31
💭 AI Öğretmen
Continuing now
05:26:38
Görsel
Görsel
05:26:41
AI Öğretmen
The maximum value of a function is the highest output it attains within a given interval.
05:26:43
AI Öğretmen
Mathematically, $f(m)$ is the maximum if, for every $x$ in the interval, $f(x) \leq f(m)$.
05:26:45
AI Öğretmen
This definition concerns the highest value on the specified interval, also called the absolute maximum on that interval.
05:26:46
AI Öğretmen
On a graph, the maximum appears as the very top or "peak" point, where the function stops increasing and begins to decrease.
05:26:47
AI Öğretmen
Not all functions have a maximum in every interval, but if present, it visually resembles the top of a mountain.
05:26:49
AI Öğretmen
Did you understand how to identify the maximum value of a function within an interval?
05:27:21
Öğrenci
I got it
05:27:24
💭 AI Öğretmen
Let us prepare the question
05:27:24
❓ Soru basic
**Example:** The graph of $g$ is shown below. Find the intervals of $x$ for which $g(x)$ is **a)** constant **b)** increasing **c)** decreasing **What is the maximum value of the function?** ![Figure](https://pajxpzsolirfrzhpksii.supabase.co/storage/v1/object/public/question-images/question_11a805a3-b66d-431d-99b4-450c738ea61d.png)
05:28:36
Öğrenci
My answer is: constant= from -2 to 1 increasing= from negative infinity to -2 and from 1 to 3 decreasing= from 3 to infinity
05:28:37
💭 AI Öğretmen
Reviewing your intervals now
05:28:41
AI Öğretmen
Your answer about the intervals where the function is constant, increasing, and decreasing is mostly correct, but you missed answering the question about the maximum value of the function.
05:28:44
AI Öğretmen
The maximum value of a function is the highest point on its graph, which means the largest y-value. In this graph, the highest point is at \( x = 3 \) where \( g(x) = 3 \).
05:28:46
AI Öğretmen
To understand this better, look for the peak point on the graph — it’s where the function stops increasing and starts decreasing. Here, that peak is at \( y = 3 \), so the maximum value is 3.
05:28:47
AI Öğretmen
A common mistake is forgetting to answer all parts of the question, especially when multiple parts are involved. Always double-check that you have answered everything asked.
05:28:49
AI Öğretmen
Therefore, the correct answer to the maximum value part should be 3.
05:28:49
AI Öğretmen
Should we continue with the lecture?
05:29:32
Öğrenci
Alright, let's continue
05:29:34
💭 AI Öğretmen
Moving forward now
05:29:40
Görsel
Görsel
05:29:43
AI Öğretmen
Think about a rollercoaster, where t stands for time and h stands for height.
05:29:45
AI Öğretmen
In this scenario, the function shows how the height of the rollercoaster changes as time goes by.
05:29:47
AI Öğretmen
The function is increasing on the interval from 0 to 5 seconds, written as $[0,5]$, because the height goes up from 0 meters to 50 meters during this time.
05:29:48
AI Öğretmen
At the time $t = 5$ seconds, the function reaches its highest point, which is 50 meters.
05:29:51
AI Öğretmen
After that, on the interval from 5 to 10 seconds, written as $[5,10]$, the function is decreasing since the height drops from 50 meters down to 10 meters.
05:29:53
AI Öğretmen
By stating intervals like $[0,5]$ and $[5,10]$, it becomes clear to see exactly when the function is going up or coming down.
05:29:55
AI Öğretmen
Did you understand how the function's increasing and decreasing intervals relate to the rollercoaster's height over time?
05:30:30
Öğrenci
I got it
05:30:32
💭 AI Öğretmen
Let us proceed carefully
05:30:32
❓ Soru basic
![Figure](https://pajxpzsolirfrzhpksii.supabase.co/storage/v1/object/public/question-images/question_5a453885-672f-4b3c-b466-4fe71a09d85a.png) **Example:** The graph of $f$ is shown above. Find the intervals of $x$ for which $f(x)$ is **a)** constant **b)** increasing **c)** decreasing **What is the maximum value of the function?**
05:31:24
Öğrenci
My answer is: constant= from -1 to 2 increasing= from minus infinity to -1 decreasing=from 2 to 3 maximum value= f(x)=2
05:31:25
💭 AI Öğretmen
Noted your answer
05:31:29
AI Öğretmen
Fantastic job! You've correctly identified the maximum value of the function.
05:31:31
AI Öğretmen
The maximum value of a function is the highest y-value (output) that the function reaches on its graph.
05:31:34
AI Öğretmen
By looking at the graph, you can see that the highest point the function ever reaches is when y = 2.
05:31:34
AI Öğretmen
This shows you understand how to interpret function graphs to find key features like maximums!
05:31:35
AI Öğretmen
Therefore the correct answer is 2.
05:31:36
AI Öğretmen
Should we continue with the lecture?
05:31:58
Öğrenci
Alright, let's continue
05:31:59
💭 AI Öğretmen
Moving to new concept
05:32:11
AI Öğretmen
In this lesson, we learned that graphs are read from left to right, which helps us understand how functions behave. We covered increasing intervals, where the function’s values rise as x increases, and decreasing intervals, where the values fall as x increases. We also discussed the maximum value of a function, which is the highest point on the graph within a given interval. Using examples like temperature changes and a rollercoaster’s height over time helped illustrate these concepts clearly. Do you have any questions about these topics? If not, we can wrap up the lesson.