AI Etüt Oturumu

Oturum Bilgileri

Başlangıç
02 December 2025, 06:43
Bitiş
Devam ediyor
Süre
16 dakika
Durum
Devam Ediyor

AI Öğretmen Değerlendirmesi

Tespit Edilen Eksikler

Konular:
  • Introduction to Functions and Linear Functions
Alt Konular:
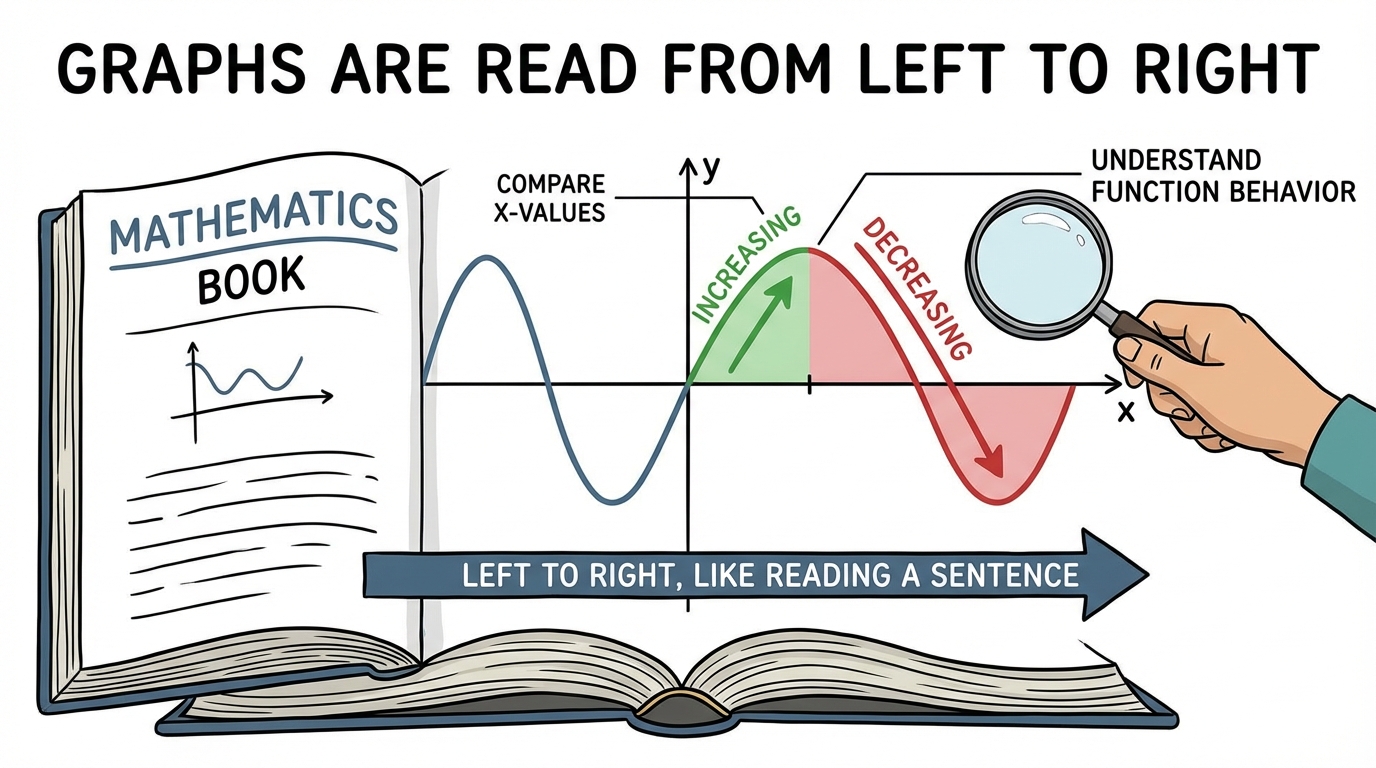
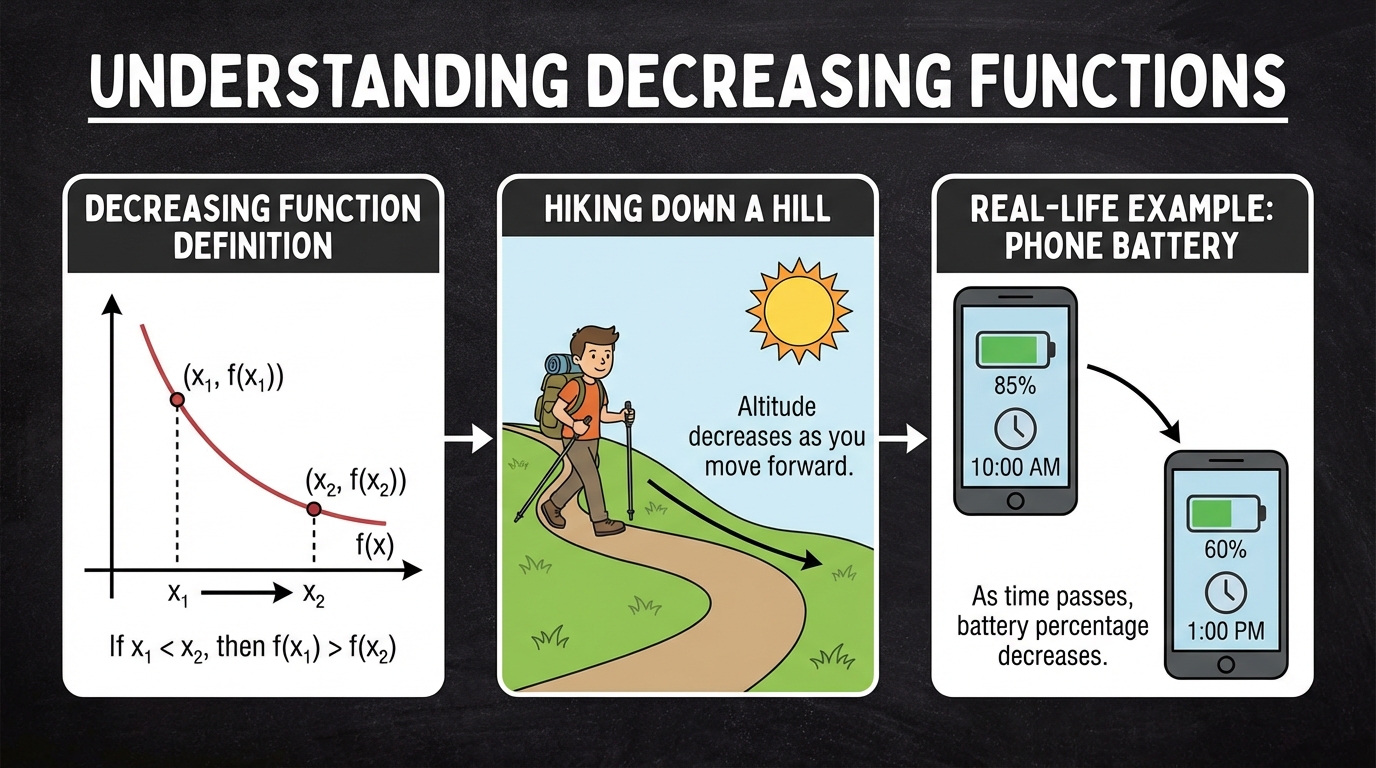
  • 2.1.c. Increasing and Decreasing Intervals of a Function

Detaylı Değerlendirme

Genel Değerlendirme

Öğrenci, fonksiyonların artan ve azalan aralıklarını grafik üzerinden belirleme konusunda temel bir anlayışa sahip. Ancak, dersin başında önemli bir notasyon hatası yaptı. Konuyla ilgili genel performansı karma olarak değerlendirilebilir.

Detaylı Analiz

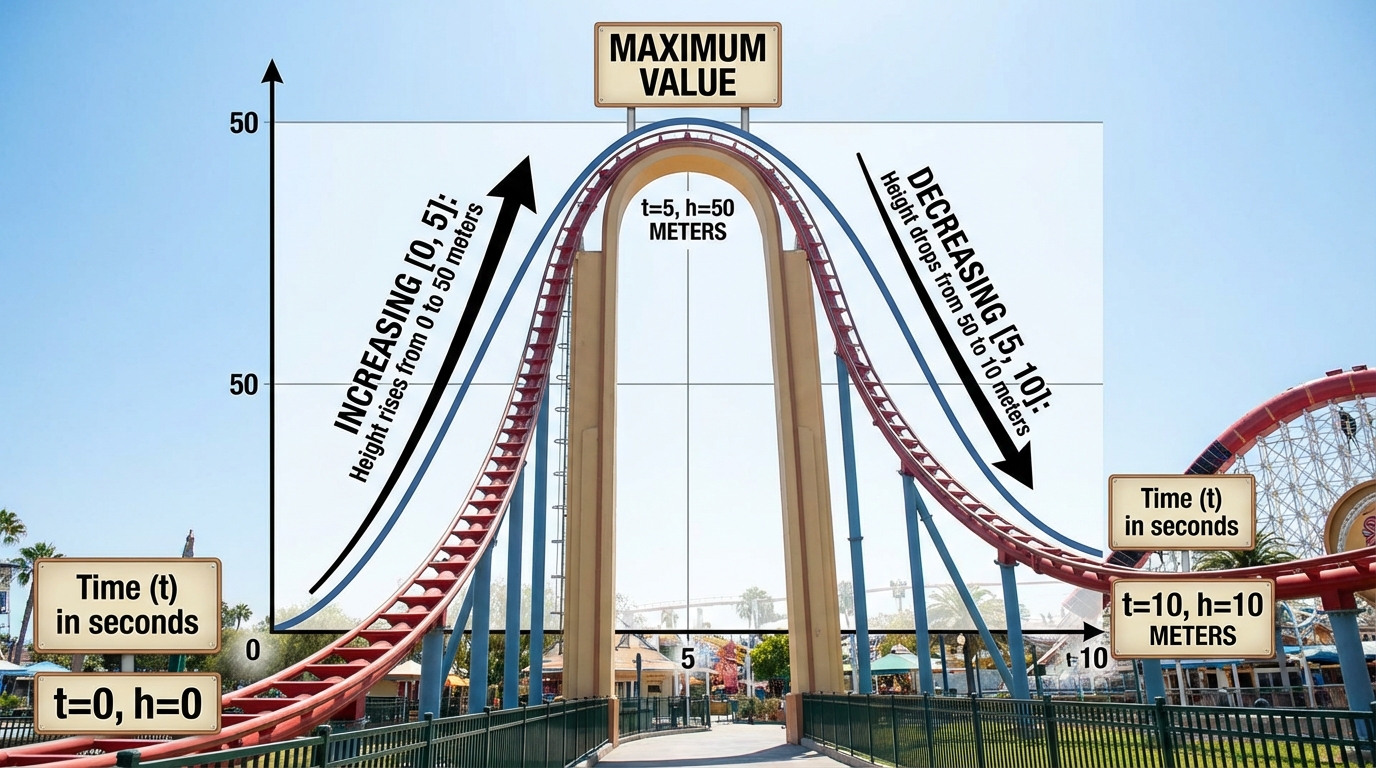
- Artan Aralıkları Belirleme: Öğrenci, fonksiyonun arttığı x-değer aralıklarını doğru bir şekilde tespit edebildi. Ancak, bu aralıkları ifade ederken köseli parantez `[]` (kapalı aralık) yerine normal parantez `()` (açık aralık) kullandı. Bu, aralıkların uç noktalarının dahil edilip edilmemesiyle ilgili kavramsal bir eksikliği veya dikkatsizliği gösteriyor.
- Azalan Aralıkları Belirleme: Öğretmenin artan aralıklarla ilgili yaptığı düzeltme ve açıklamadan sonra, öğrenciye azalan aralık sorulduğunda bu sefer hem aralığı doğru tespit etti hem de doğru olan köseli parantez `[]` notasyonunu kullandı. Bu, öğrencinin geri bildirimden ders çıkardığını ve hatasını düzelttiğini gösteren olumlu bir işarettir.
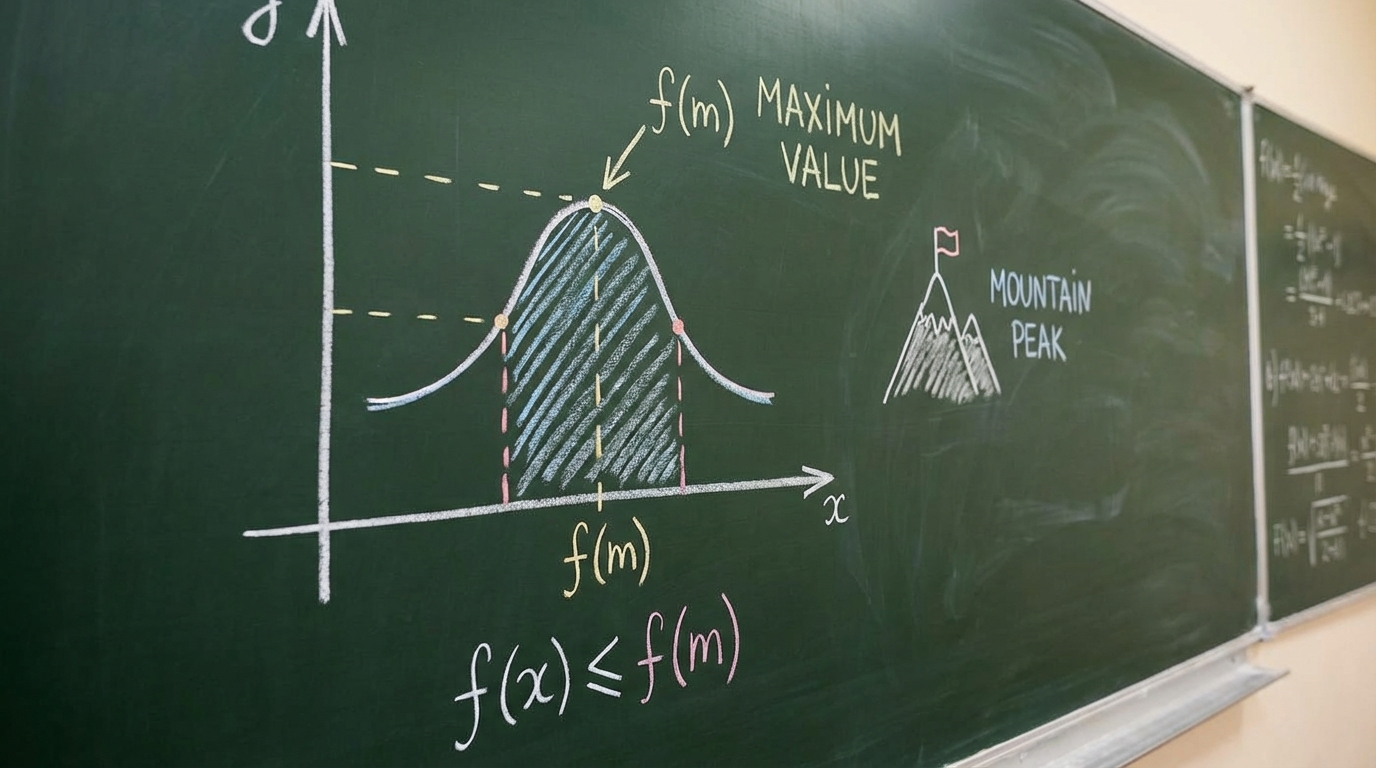
- Maksimum Değeri Bulma: Öğrenci, kendisine sorulan iki farklı soruda da fonksiyonun maksimum değerini (grafikteki en yüksek y değeri) hatasız ve hızlı bir şekilde buldu. Bu, grafiğin tepe noktalarını okuma konusunda iyi olduğunu gösteriyor.

Sonuç

Öğrencinin en belirgin eksiği, aralıkları ifade ederken kullanılan matematiksel notasyon (açık/kapalı aralık) konusundadır. İlk sorudaki hatasına rağmen, ikinci soruda bu hatayı düzeltmesi konuyu öğrendiğine işaret etmektedir. Grafik üzerinden temel özellikleri (nerede artıyor, nerede azalıyor, tepe noktası neresi) anlama konusunda ise başarılıdır. Notasyon konusunun pekiştirilmesi faydalı olacaktır.

📜 Oturum Detayları

06:43:55
Öğrenci
Yes, I am ready! Can you explain this topic in detail?
06:43:56
💭 AI Öğretmen
Preparing the explanation now
06:43:56
Görsel
Görsel
06:43:59
AI Öğretmen
Graphs in mathematics are always read from left to right, just like reading a sentence in English.
06:44:01
AI Öğretmen
This is very important because it helps us understand how a function behaves as we move from the start of the graph to the end.
06:44:03
AI Öğretmen
When we compare two $x$-values, we always start with the $x$ on the left and move towards the $x$ on the right.
06:44:04
AI Öğretmen
By using this left-to-right direction, we can see if the function is going up or down between the two $x$-values.
06:44:05
AI Öğretmen
Thinking this way makes it easier to tell when a function is increasing or decreasing on the graph.
06:44:07
AI Öğretmen
This perspective helps us define the intervals where the function goes up or goes down very clearly.
06:44:08
AI Öğretmen
Did you understand how reading graphs from left to right helps us identify increasing and decreasing intervals?
06:45:01
Öğrenci
I got it
06:45:03
💭 AI Öğretmen
Let's continue now
06:45:04
🎥 Video
06:45:04
AI Öğretmen
Did you understand what it means for a function to be increasing over an interval?
06:46:04
Öğrenci
I got it
06:46:08
💭 AI Öğretmen
Let us proceed now
06:46:08
❓ Soru basic
![Figure](https://pajxpzsolirfrzhpksii.supabase.co/storage/v1/object/public/question-images/question_33e16c0c-dc3a-47bd-91c9-e1d47eecd95c.png) Example: The graph of f is shown on the below. Find the intervals of x for which f(x) is **increasing**.
06:48:18
Öğrenci
My answer is: (-5,-2)U (0,3)
06:48:19
💭 AI Öğretmen
Let me review that answer
06:48:26
AI Öğretmen
Your answer was not correct, let me explain why. The intervals where the function is increasing should include the endpoints where the function starts or stops increasing, which means using closed intervals [ ] instead of open intervals ( ).
06:48:28
AI Öğretmen
When a function is increasing, it means the y-values go up as x moves from left to right. At the points where the function reaches a peak or starts increasing, we include those points because the function is still rising up to them.
06:48:32
AI Öğretmen
For example, from x = -5 to x = -2, the function goes up and reaches a peak at -2, so the interval should be [-5, -2]. Similarly, from x = 0 to x = 3, the function increases again, so we write [0, 3].
06:48:36
AI Öğretmen
Your mistake was using open intervals (-5,-2) and (0,3), which exclude the endpoints, but here the function is increasing right up to those points, so the correct intervals are [-5, -2] ∪ [0, 3].
06:48:37
AI Öğretmen
Therefore, the correct answer should be [-5, -2] ∪ [0, 3].
06:48:37
AI Öğretmen
Should we continue with the lecture?
06:50:27
Öğrenci
Alright, let's continue
06:50:28
💭 AI Öğretmen
Moving forward now
06:50:37
Görsel
Görsel
06:50:41
AI Öğretmen
A function is called decreasing on an interval if, whenever you pick two numbers $x_1$ and $x_2$ in that interval, and $x_1$ is less than $x_2$, then $f(x_1)$ is greater than $f(x_2)$.
06:50:42
AI Öğretmen
Think of it like walking down a hill—each step forward you take, your height gets lower because you’re going downhill.
06:50:44
AI Öğretmen
Another example is your phone’s battery during the day. As time moves forward, the battery percentage goes down. This means the battery is a decreasing function as time goes on.
06:50:45
AI Öğretmen
Did this explanation of decreasing functions make sense to you?
06:51:40
Öğrenci
I got it
06:51:42
💭 AI Öğretmen
Let us proceed with the question
06:51:43
❓ Soru basic
![Figure](https://pajxpzsolirfrzhpksii.supabase.co/storage/v1/object/public/question-images/question_fb69fa74-e294-4d91-a021-e549025bd3c4.png) Example: The graph of $f$ is shown on the above. Find the intervals of $x$ for which $f(x)$ is **decreasing**.
06:53:57
Öğrenci
My answer is: [-2,0]
06:53:58
💭 AI Öğretmen
Checking your answer carefully
06:54:02
AI Öğretmen
That's absolutely right! Fantastic job!
06:54:04
AI Öğretmen
You correctly identified that the function is decreasing in the interval `[-2, 0]` because the graph is moving downwards from left to right in that section.
06:54:05
AI Öğretmen
Remember, a function is decreasing when its y-values get smaller as the x-values increase, which you can clearly see here!
06:54:08
AI Öğretmen
Keep up the great work!
06:54:08
AI Öğretmen
Therefore, the correct answer is [-2, 0].
06:54:09
AI Öğretmen
Should we continue with the lecture?
06:54:41
Öğrenci
Alright, let's continue
06:54:42
💭 AI Öğretmen
Preparing the next example
06:54:47
Görsel
Görsel
06:54:49
AI Öğretmen
The maximum value of a function is the biggest output it can reach in a specific interval.
06:54:51
AI Öğretmen
In math, we say $f(m)$ is the maximum if, for every $x$ in the interval, $f(x)$ is always less than or equal to $f(m)$.
06:54:53
AI Öğretmen
This means $f(m)$ is the highest value the function gets to on the chosen interval, and we call this the absolute maximum there.
06:54:54
AI Öğretmen
If you look at a graph, this maximum point is at the very top, like the "peak" or top of a hill, where the line stops rising and starts to go down.
06:54:56
AI Öğretmen
It is important to remember that not every function will have a maximum in every interval, but if it does, it will look like the top of a mountain.
06:54:58
AI Öğretmen
Did you understand how to identify the maximum value of a function on an interval?
06:55:33
Öğrenci
I got it
06:55:36
💭 AI Öğretmen
Let's review this carefully
06:55:37
❓ Soru basic
**Example:** The graph of $g$ is shown below. Find the intervals of $x$ for which $g(x)$ is **a)** constant **b)** increasing **c)** decreasing **What is the maximum value of the function?** ![Figure](https://pajxpzsolirfrzhpksii.supabase.co/storage/v1/object/public/question-images/question_11a805a3-b66d-431d-99b4-450c738ea61d.png)
06:56:26
Öğrenci
My answer is: max=3
06:56:27
💭 AI Öğretmen
Noted your answer
06:56:31
AI Öğretmen
Fantastic job! You've correctly identified the maximum value of the function.
06:56:32
AI Öğretmen
The maximum value of a function is the highest y-value it reaches on its graph, and you found that peak perfectly!
06:56:33
AI Öğretmen
This shows you have a great understanding of how to interpret function graphs and identify key features like maximums. Keep up the excellent work!
06:56:35
AI Öğretmen
Therefore the correct answer is 3
06:56:35
AI Öğretmen
Should we continue with the lecture?
06:57:08
Öğrenci
Alright, let's continue
06:57:09
💭 AI Öğretmen
Moving forward now
06:57:17
Görsel
Görsel
06:57:20
AI Öğretmen
Think about a rollercoaster where the variable $t$ means time and $h$ stands for height.
06:57:21
AI Öğretmen
Here, the function we are looking at shows how the height of the rollercoaster changes as time passes.
06:57:22
AI Öğretmen
The function is called increasing on the interval from $0$ to $5$ seconds, written as $[0,5]$.
06:57:24
AI Öğretmen
This means that between $0$ and $5$ seconds, the rollercoaster goes up, starting at $0$ meters and reaching $50$ meters high as time moves forward.
06:57:25
AI Öğretmen
At exactly $t = 5$ seconds, the rollercoaster is at its highest point, which is $50$ meters.
06:57:27
AI Öğretmen
After this, from $5$ to $10$ seconds, written as $[5,10]$, the function is decreasing.
06:57:28
AI Öğretmen
This tells us that from $5$ seconds to $10$ seconds, the height goes down, dropping from $50$ meters to $10$ meters.
06:57:31
AI Öğretmen
When we use intervals like $[0,5]$ to show where the function increases, and $[5,10]$ to show where it decreases, it makes it clear when the rollercoaster is going up or down.
06:57:32
AI Öğretmen
Did you understand how the intervals show when the rollercoaster’s height is increasing or decreasing?
06:58:26
Öğrenci
I got it
06:58:28
💭 AI Öğretmen
Let us review this carefully
06:58:28
❓ Soru basic
![Figure](https://pajxpzsolirfrzhpksii.supabase.co/storage/v1/object/public/question-images/question_5a453885-672f-4b3c-b466-4fe71a09d85a.png) **Example:** The graph of $f$ is shown above. Find the intervals of $x$ for which $f(x)$ is **a)** constant **b)** increasing **c)** decreasing **What is the maximum value of the function?**
06:58:50
Öğrenci
My answer is: max=2
06:58:51
💭 AI Öğretmen
Noted your answer
06:58:57
AI Öğretmen
Fantastic job! You've correctly identified the maximum value of the function.
06:58:59
AI Öğretmen
The maximum value of a function is the highest y-value it reaches on its graph.
06:59:00
AI Öğretmen
By looking at the graph, we can see that the highest point the function reaches is at y = 2.
06:59:01
AI Öğretmen
This shows you have a great understanding of how to interpret function graphs!
06:59:03
AI Öğretmen
Therefore the correct answer is 2.
06:59:03
AI Öğretmen
Should we continue with the lecture?
06:59:45
Öğrenci
Alright, let's continue
06:59:46
💭 AI Öğretmen
Proceeding with the lesson
06:59:54
AI Öğretmen
In this lesson, we covered how to read graphs from left to right to understand function behavior, defined increasing and decreasing intervals, and learned how to identify the maximum value of a function on a given interval using real-life examples like temperature changes and a rollercoaster’s height. Do you have any questions about these topics? If not, we can wrap up the session.