AI Etüt Oturumu
Oturum Bilgileri
AI Öğretmen Değerlendirmesi
Tespit Edilen Eksikler
- Introduction to Functions and Linear Functions
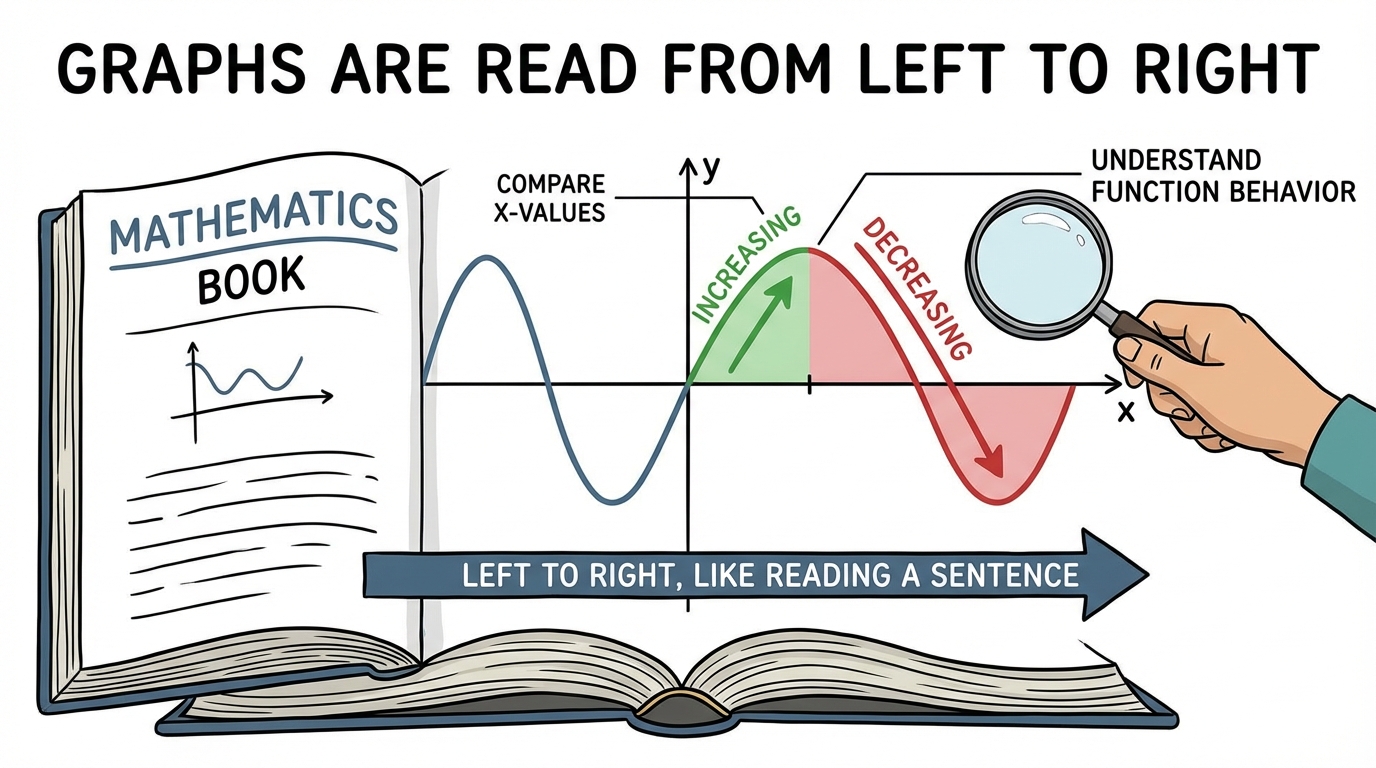
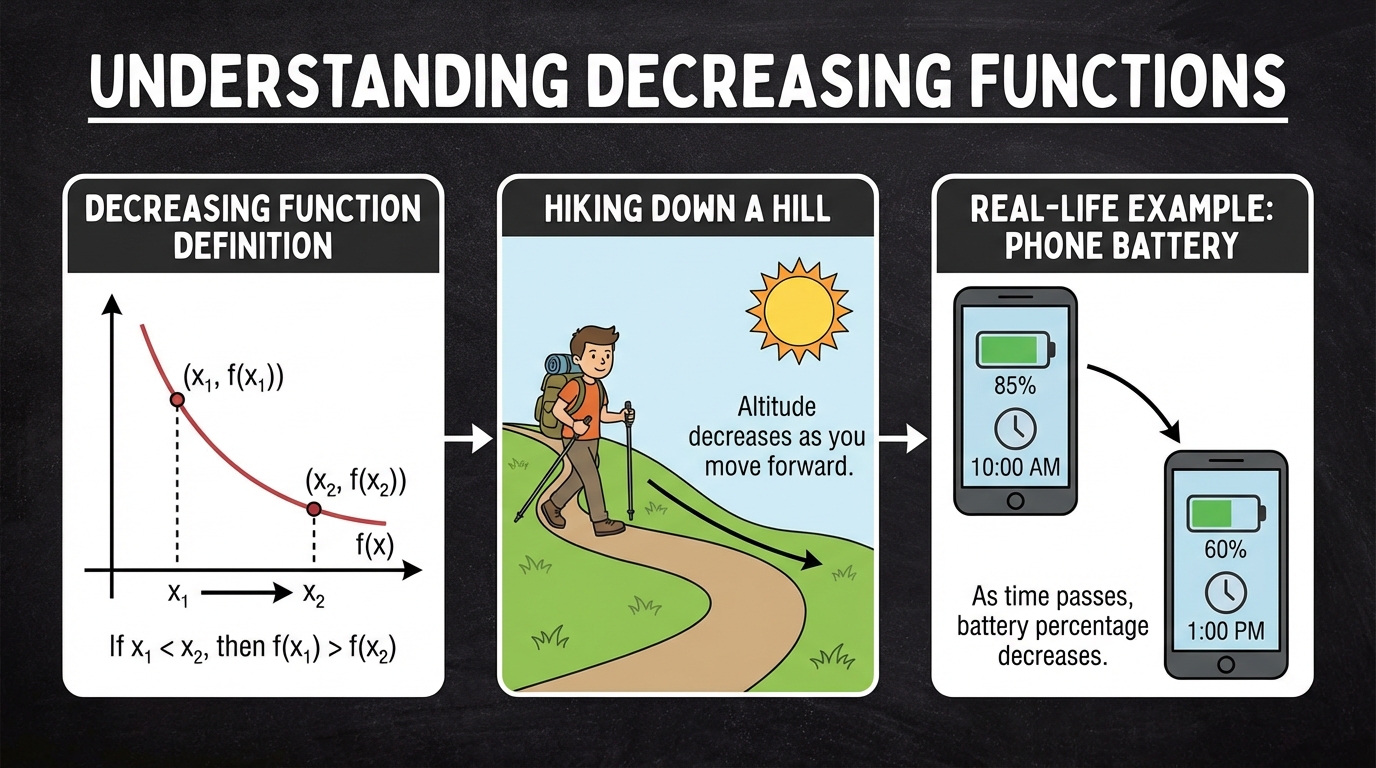
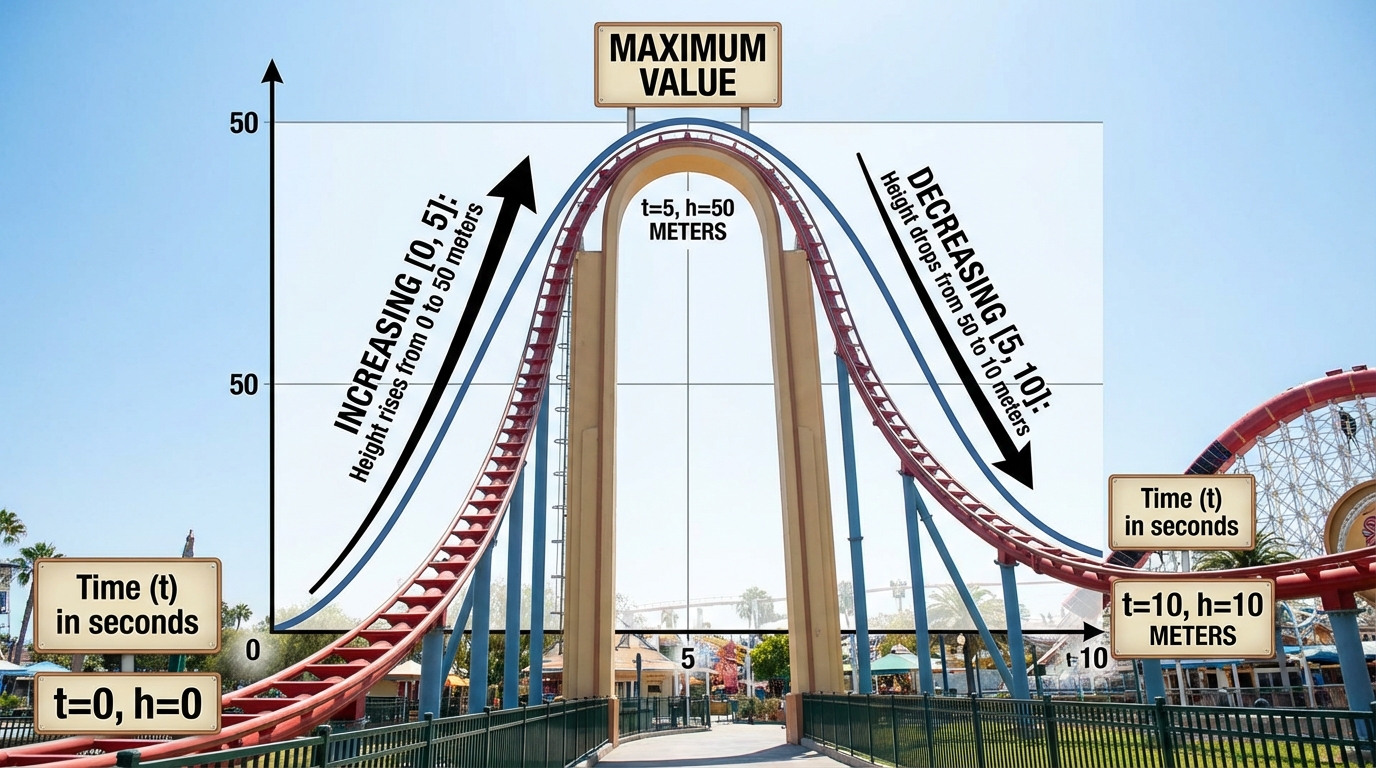
- 2.1.c. Increasing and Decreasing Intervals of a Function
Detaylı Değerlendirme
Genel Değerlendirme
Öğrenci, dersin başında konuyu öğrenmeye istekli olduğunu belirtmiştir. Ders boyunca basit anlama kontrollerine ("I got it") şeklinde olumlu yanıtlar vermiştir. Ancak, fonksiyonun artan ve azalan aralıklarını belirlemeye yönelik sorularda temel bir kavram yanılgısı sergilemiştir. Öğrenci, aralıkları doğru bir şekilde tespit etse de, bu aralıkları ifade ederken sürekli olarak uç noktaları dahil etmeyen açık aralık parantezleri `()` kullanmıştır. Bu hata, hem artan hem de azalan aralıkları belirlemesi istendiğinde tekrarlanmıştır. Bu durum, öğrencinin aralık gösterimi ve uç noktaların aralığa dahil edilip edilmemesi gerektiği konusunda eksiklikleri olduğunu göstermektedir.
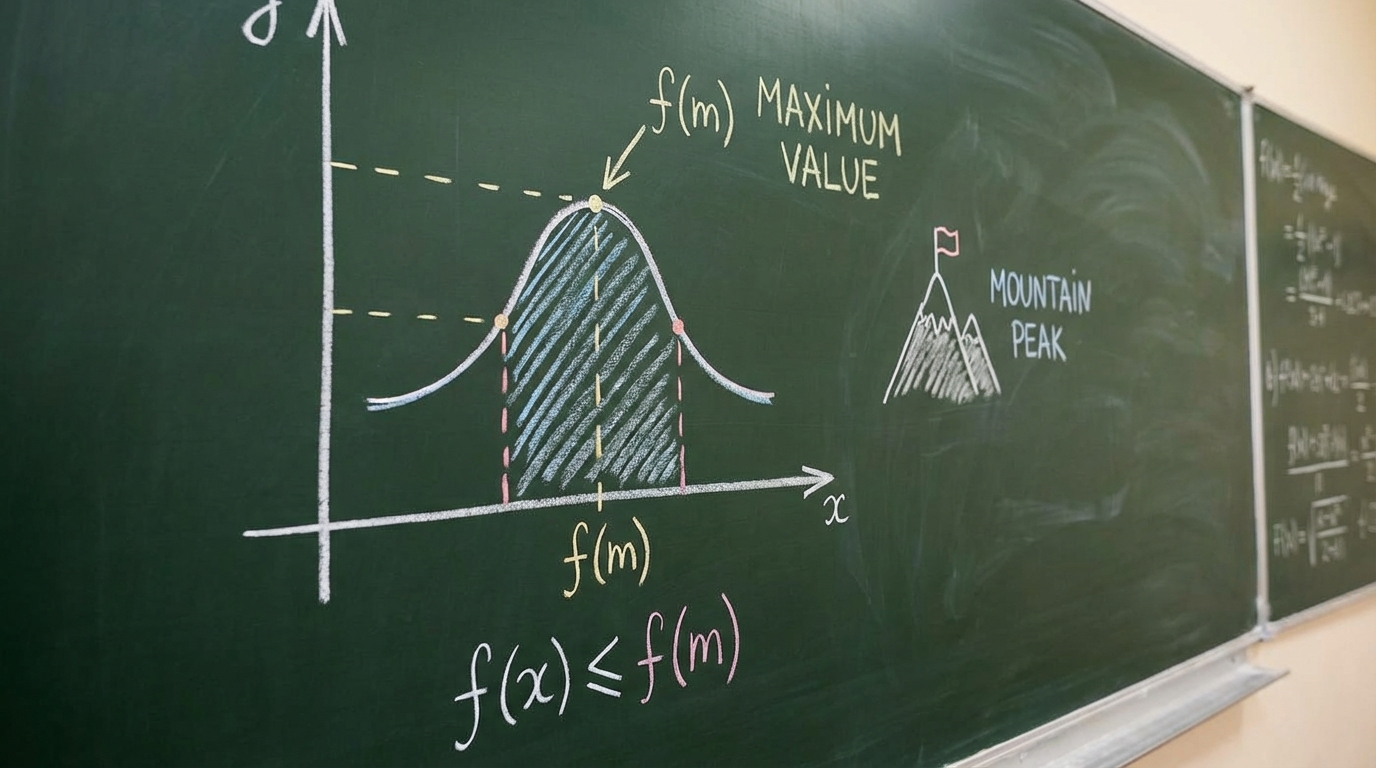
Buna karşın, öğrenci bir fonksiyonun grafiğindeki maksimum değeri bulma konusunda başarılı olmuştur. Bu konudaki iki soruyu da doğru yanıtlamıştır.
Konu Bazında Eksiklikler
* 2.1.c. Increasing and Decreasing Intervals of a Function: Öğrenci, bir fonksiyonun grafiğinde artan ve azalan olduğu x-değer aralıklarını doğru bir şekilde belirleyebilse de, bu aralıkları matematiksel olarak doğru ifade edememiştir. Uç noktaların aralığa dahil edilmesi gereken durumlarda (köşeli parantez `[]` kullanımı) sürekli olarak açık aralık parantezleri `()` kullanmıştır. Bu, ders boyunca tutarlı bir şekilde tekrarlanan bir hatadır.
* Örnek 1 (Artan Aralık): `(-5,-2) U (0,3)` cevabını vermiştir. Doğru cevap `[-5, -2] ∪ [0, 3]` olmalıydı.
* Örnek 2 (Azalan Aralık): `(-2,0)` cevabını vermiştir. Doğru cevap `[-2, 0]` olmalıydı.
İyi Olduğu Konular
* Öğrenci, bir fonksiyonun grafiği üzerinden maksimum değerini okuma konusunda başarılıdır. Bu konseptle ilgili sorulan iki farklı soruda da grafiğin ulaştığı en yüksek y-değerini doğru bir şekilde tespit etmiştir. Ancak bu kazanım, genel olarak artan/azalan aralıklar konusundaki temel gösterim hatası nedeniyle "iyi olduğu konular" listesine eklenmemiştir. Kural gereği, bir konuda karma performans varsa konu eksiklikler listesine eklenmelidir.
Ders Dışı Sorular/Yorumlar
* Bu derste öğrencinin tamamen konu dışı bir sorusu veya yorumu olmamıştır.