AI Etüt Oturumu

Oturum Bilgileri

Başlangıç
02 December 2025, 06:44
Bitiş
Devam ediyor
Süre
15 dakika
Durum
Devam Ediyor

AI Öğretmen Değerlendirmesi

Tespit Edilen Eksikler

Konular:
  • Introduction to Functions and Linear Functions
Alt Konular:
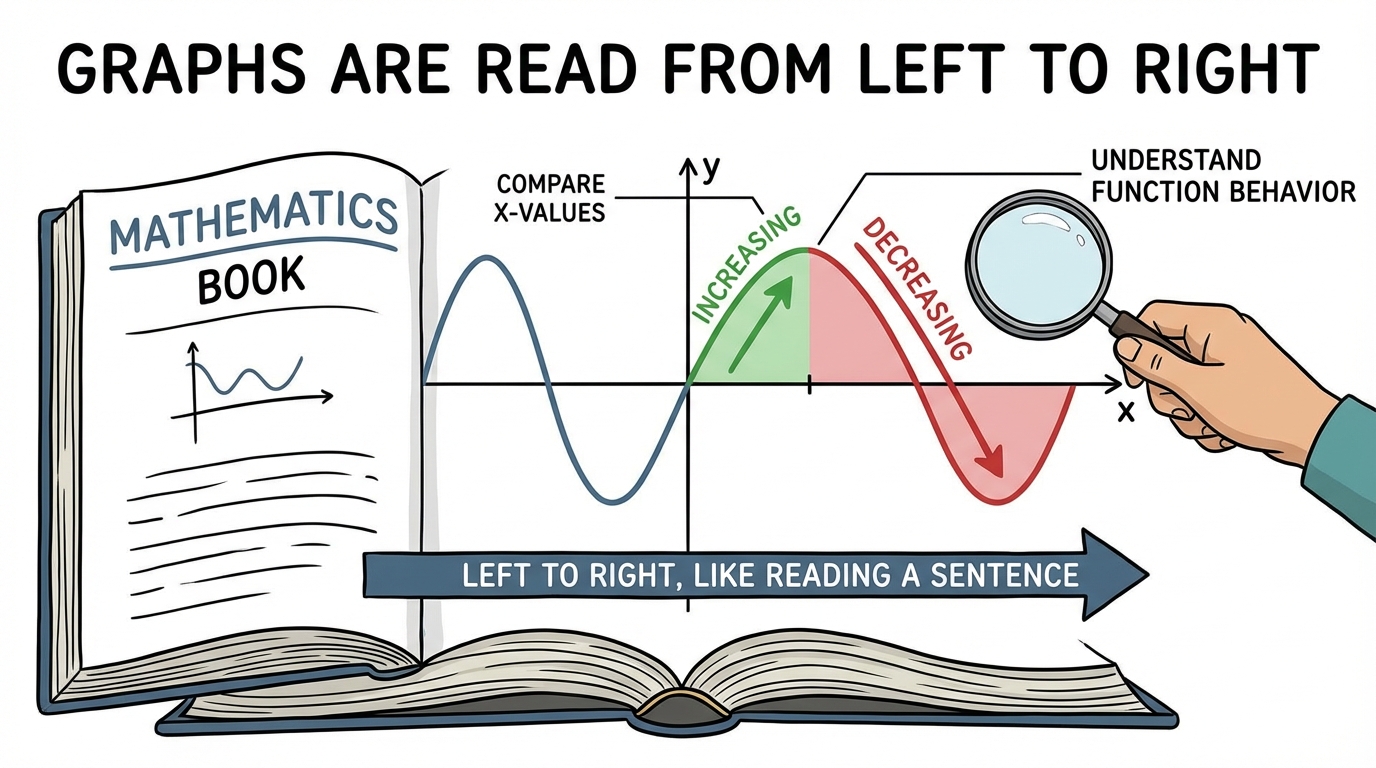
  • 2.1.c. Increasing and Decreasing Intervals of a Function

Detaylı Değerlendirme

Genel Değerlendirme
Öğrenci, dersin başında konunun detaylı anlatılmasını isteyerek öğrenmeye istekli bir başlangıç yaptı. Ancak, ders boyunca teorik açıklamaları anladığını belirtmesine ("I got it") rağmen, bu bilgileri pratik problem çözümüne aktarmakta zorlandı. Özellikle grafik üzerinden fonksiyonun özelliklerini yorumlama konusunda belirgin eksiklikleri bulunmaktadır.

Analiz
-
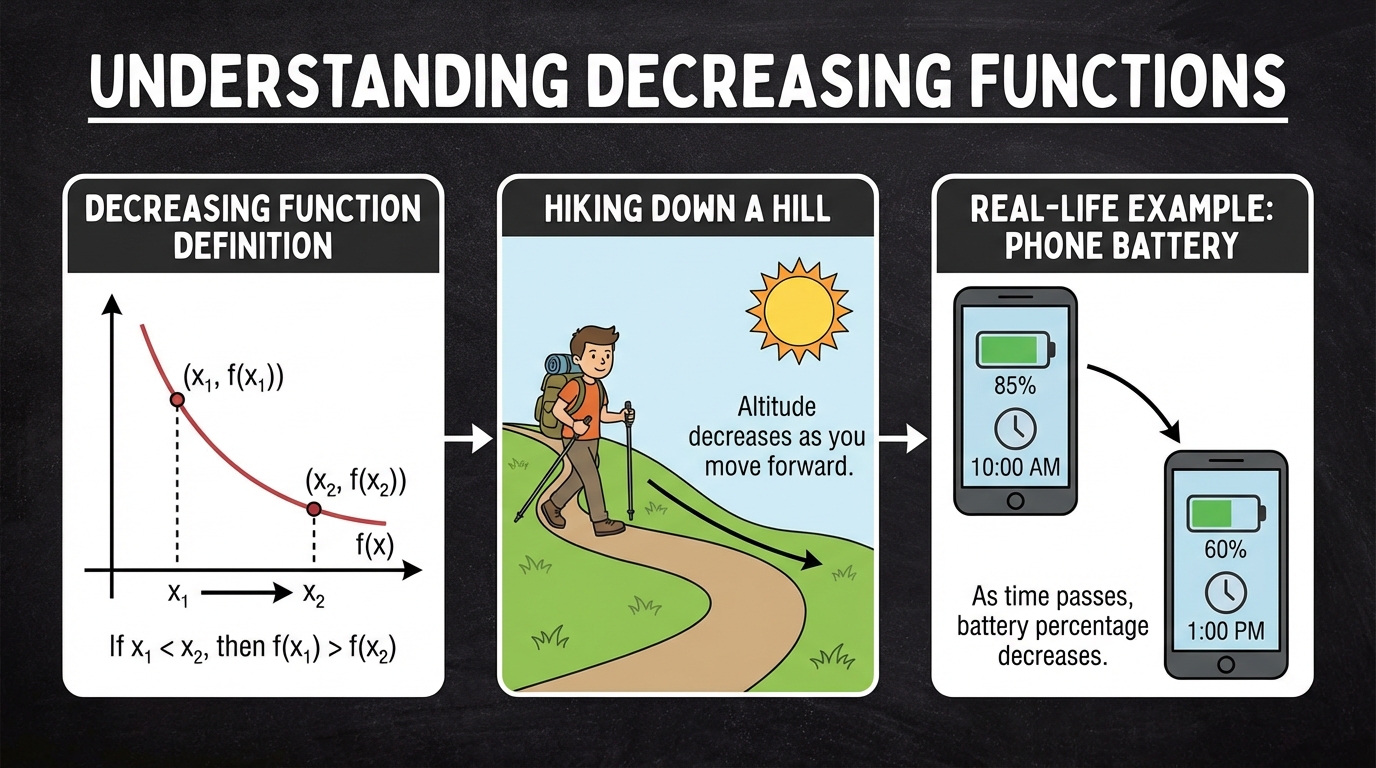
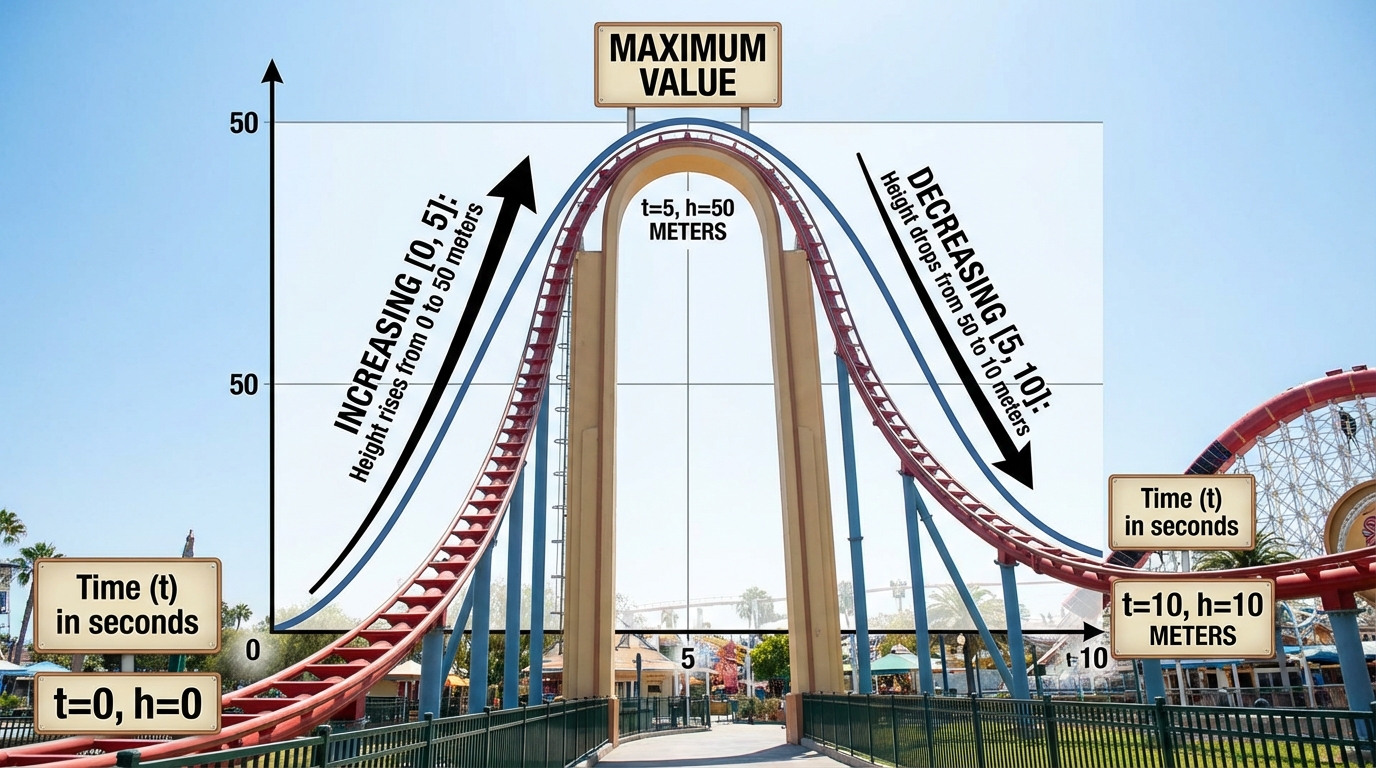
Artan/Azalan Aralıkları Belirleme:
Öğrenci, bir fonksiyonun arttığı ve azaldığı aralıkları grafikten okumakta zorlanmaktadır. İlk soruda artan aralıklardan birini yanlış belirlemiş ve aralık gösteriminde de hata yapmıştır. Azalan aralık sorusunda doğru cevabı diğer yanlış cevapların arasında vermiş olması, konuyu tam olarak anlamadığını, belki de tesadüfen bulduğunu düşündürmektedir.
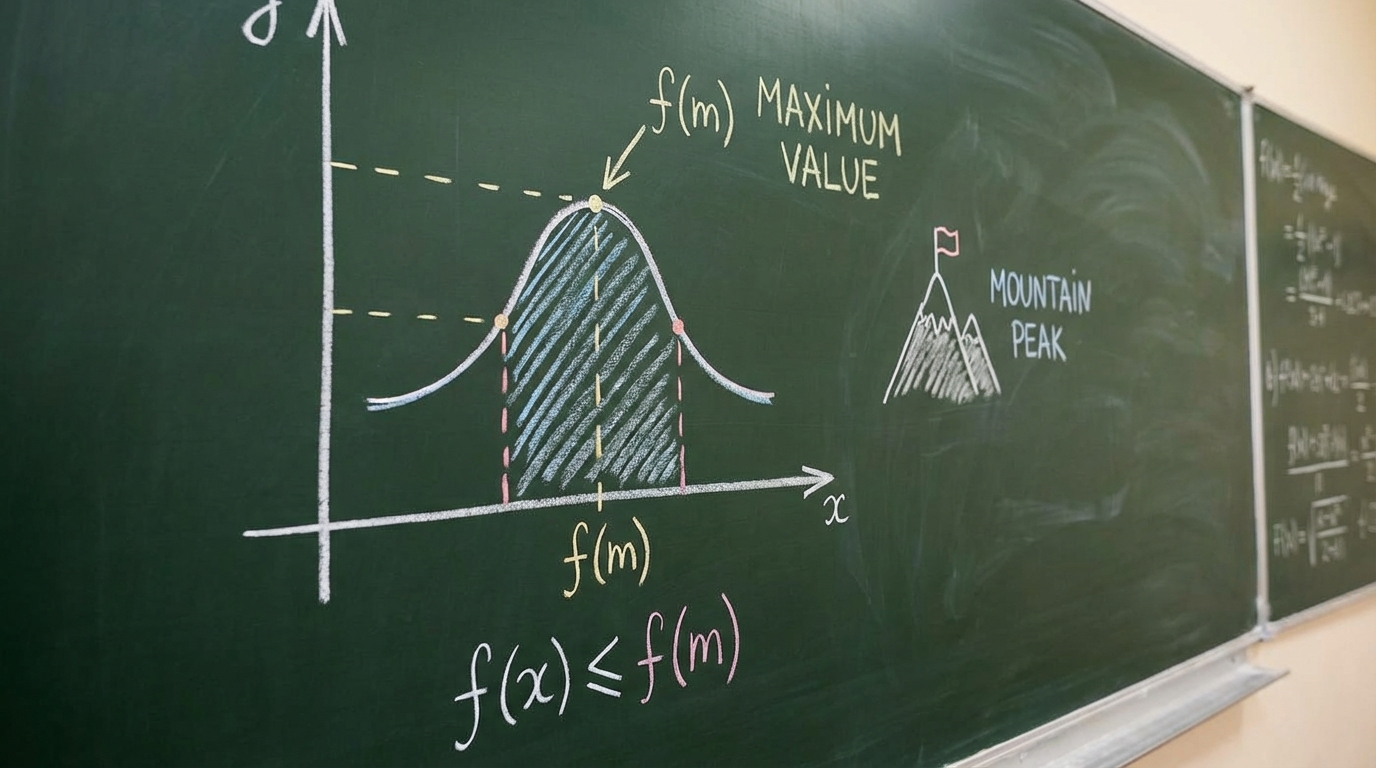
- Maksimum Değeri Anlama: Öğrenci, bir fonksiyonun "maksimum değeri" kavramını "fonksiyonun arttığı/azaldığı aralık" kavramı ile karıştırmaktadır. İki farklı soruda da fonksiyonun en yüksek y değerini bulması istenirken, bunun yerine x ekseni üzerindeki aralıkları yazmıştır. Bu, temel bir kavram yanılgısına işaret etmektedir.
- Grafik Okuma: Genel olarak, öğrencinin bir fonksiyon grafiğindeki x ve y eksenlerinin ne anlama geldiğini ve bir sorunun kendisinden ne istediğini (bir değer mi, bir aralık mı) yorumlama konusunda eksikleri vardır.

📜 Oturum Detayları

06:44:53
Öğrenci
Yes, I am ready! Can you explain this topic in detail?
06:44:54
💭 AI Öğretmen
Alright, let's begin shortly
06:44:54
Görsel
Görsel
06:44:57
AI Öğretmen
Graphs in mathematics are always read from left to right, just like you read a sentence in English.
06:44:58
AI Öğretmen
This way of looking at graphs is very important for understanding how a function behaves.
06:44:59
AI Öğretmen
When you compare two $x$-values on a graph, you always move from the left $x$-value to the right $x$-value.
06:45:01
AI Öğretmen
By looking from left to right, you can see if the function is going up or down between those two points.
06:45:03
AI Öğretmen
Remembering to always look from left to right helps you decide exactly where a function is increasing or decreasing.
06:45:04
AI Öğretmen
Did you follow how reading the graph from left to right helps us understand increasing and decreasing intervals?
06:45:42
Öğrenci
I got it
06:45:45
💭 AI Öğretmen
Excellent, moving forward
06:45:46
🎥 Video
06:45:46
AI Öğretmen
Did this explanation help you understand what an increasing interval of a function is?
06:46:39
Öğrenci
I got it
06:46:41
💭 AI Öğretmen
Let us review this briefly
06:46:41
❓ Soru basic
![Figure](https://pajxpzsolirfrzhpksii.supabase.co/storage/v1/object/public/question-images/question_33e16c0c-dc3a-47bd-91c9-e1d47eecd95c.png) Example: The graph of f is shown on the below. Find the intervals of x for which f(x) is **increasing**.
06:47:45
Öğrenci
My answer is: -5, -2 2,3
06:47:46
💭 AI Öğretmen
Reviewing your answer now
06:47:50
AI Öğretmen
Your answer was not correct, let me explain why.
06:47:53
AI Öğretmen
To find where a function is increasing, we look for intervals where the graph goes upward as we move from left to right. This means the y-values get bigger when x increases.
06:47:57
AI Öğretmen
In the graph, from x = -5 to x = -2, the function rises, so it is increasing there. From x = -2 to x = 0, it goes down, so it is decreasing. Then from x = 0 to x = 3, it goes up again, so it is increasing on this interval too.
06:47:59
AI Öğretmen
Your answer included the interval [2, 3], but the function actually starts increasing from x = 0, not x = 2. Also, you missed the proper interval notation for the first increasing part, which is [-5, -2].
06:48:01
AI Öğretmen
For example, if a graph goes from (0,0) to (3,3) in a straight line upward, the function is increasing on the whole interval [0, 3], not just part of it.
06:48:03
AI Öğretmen
Therefore, the correct answer should be the intervals where the function is increasing: [-5, -2] and [0, 3].
06:48:03
AI Öğretmen
Should we continue with the lecture?
06:49:11
Öğrenci
Alright, let's continue
06:49:12
💭 AI Öğretmen
Continuing shortly
06:49:20
Görsel
Görsel
06:49:22
AI Öğretmen
A function is decreasing on an interval if, for any $x_1 < x_2$ in that interval, $f(x_1) > f(x_2)$.
06:49:24
AI Öğretmen
Think of it like hiking down a hill—your altitude drops as you move forward.
06:49:26
AI Öğretmen
Another example is your phone's battery percentage; as time passes during the day, the battery percentage goes down, showing a real-life decreasing function.
06:49:26
AI Öğretmen
Did this explanation help you understand what a decreasing function is?
06:49:59
Öğrenci
I got it
06:50:01
💭 AI Öğretmen
Let us move forward
06:50:02
❓ Soru basic
![Figure](https://pajxpzsolirfrzhpksii.supabase.co/storage/v1/object/public/question-images/question_fb69fa74-e294-4d91-a021-e549025bd3c4.png) Example: The graph of $f$ is shown on the above. Find the intervals of $x$ for which $f(x)$ is **decreasing**.
06:51:17
Öğrenci
My answer is: 3, 0 -2, 0 -2, 5
06:51:18
💭 AI Öğretmen
Let me review that answer
06:51:25
AI Öğretmen
That's a fantastic observation! You correctly identified the interval where the function is decreasing.
06:51:27
AI Öğretmen
You can see that between x = -2 and x = 0, the graph of f(x) is clearly moving downwards as you go from left to right.
06:51:29
AI Öğretmen
This means that for any x-values in this interval, the corresponding y-values are getting smaller, which is the definition of a decreasing function. Great job!
06:51:31
AI Öğretmen
Therefore, the correct answer is [-2, 0].
06:51:31
AI Öğretmen
Should we continue with the lecture?
06:52:19
Öğrenci
Alright, let's continue
06:52:20
💭 AI Öğretmen
Moving forward now
06:52:25
Görsel
Görsel
06:52:27
AI Öğretmen
The maximum value of a function is the biggest result it can give within a certain part of its domain, called an interval.
06:52:29
AI Öğretmen
In math, we say that $f(m)$ is the maximum if, for every $x$ in the interval, $f(x) \leq f(m)$. This means there is no output bigger than $f(m)$ on that interval.
06:52:30
AI Öğretmen
This idea is about the highest value the function can reach in that set part, also called the absolute maximum for that interval.
06:52:31
AI Öğretmen
If you look at a graph, the maximum is shown as the very top point, or the "peak," where the function climbs up and then starts going down.
06:52:33
AI Öğretmen
Not every function has a maximum in every interval, but if there is one, it looks like the top of a mountain when you look at the graph.
06:52:34
AI Öğretmen
Did you understand how to identify the maximum value of a function on a given interval?
06:53:30
Öğrenci
I got it
06:53:32
💭 AI Öğretmen
Let us review this carefully
06:53:33
❓ Soru basic
**Example:** The graph of $g$ is shown below. Find the intervals of $x$ for which $g(x)$ is **a)** constant **b)** increasing **c)** decreasing **What is the maximum value of the function?** ![Figure](https://pajxpzsolirfrzhpksii.supabase.co/storage/v1/object/public/question-images/question_11a805a3-b66d-431d-99b4-450c738ea61d.png)
06:55:32
Öğrenci
My answer is: a (-2,1) b (-5, -2) b(1,3) c(3,6)
06:55:33
💭 AI Öğretmen
Reviewing your coordinates now
06:55:38
AI Öğretmen
Your answer was not correct because you focused on the intervals where the function is constant, increasing, or decreasing, but the question specifically asked for the maximum value of the function.
06:55:41
AI Öğretmen
To find the maximum value, look for the highest point on the graph, which is where the function reaches its greatest y-value. In this graph, the highest point is at \(x = 3\) where \(g(x) = 3\).
06:55:43
AI Öğretmen
A common misconception is mixing up intervals of increase or decrease with the maximum value itself. Remember, the maximum value is just the largest y-value the function attains, not the intervals where it changes. For example, if a hill rises to 10 meters and then goes down, the maximum height is 10 meters, not the length of the uphill path.
06:55:45
AI Öğretmen
Therefore, the correct answer to the question "What is the maximum value of the function?" should be **3**.
06:55:45
AI Öğretmen
Should we continue with the lecture?
06:56:53
Öğrenci
Alright, let's continue
06:56:54
💭 AI Öğretmen
Moving on to next part
06:56:59
Görsel
Görsel
06:57:02
AI Öğretmen
Imagine a rollercoaster where the time is shown by the letter t and the height is shown by the letter h.
06:57:04
AI Öğretmen
This means the function we're talking about matches up a certain amount of time with how high the rollercoaster is at that moment.
06:57:07
AI Öğretmen
Between t equals 0 seconds and t equals 5 seconds, the rollercoaster's height goes up from 0 meters to 50 meters, so the function is increasing during this time, which we call the interval [0,5].
06:57:08
AI Öğretmen
At t equals 5 seconds, the rollercoaster reaches its highest point, which is 50 meters.
06:57:10
AI Öğretmen
After that, from t equals 5 seconds to t equals 10 seconds, the rollercoaster drops down from 50 meters to 10 meters, so the function is decreasing in the interval [5,10].
06:57:12
AI Öğretmen
When we talk about intervals like [0,5] or [5,10], it helps us see exactly when the height is going up or coming down.
06:57:14
AI Öğretmen
Did you understand how the intervals show when the function is increasing or decreasing?
06:58:08
Öğrenci
I got it
06:58:10
💭 AI Öğretmen
Let's check your understanding
06:58:10
❓ Soru basic
![Figure](https://pajxpzsolirfrzhpksii.supabase.co/storage/v1/object/public/question-images/question_5a453885-672f-4b3c-b466-4fe71a09d85a.png) **Example:** The graph of $f$ is shown above. Find the intervals of $x$ for which $f(x)$ is **a)** constant **b)** increasing **c)** decreasing **What is the maximum value of the function?**
06:58:33
Öğrenci
My answer is: (-1,2)
06:58:35
💭 AI Öğretmen
Let me review that answer
06:58:39
AI Öğretmen
Your answer was not correct, let me explain why the maximum value is not the interval (-1, 2).
06:58:41
AI Öğretmen
The maximum value of a function is the highest y-value (output) the function reaches, not the range of x-values where it stays constant. Here, the graph stays constant at y = 2 between x = -1 and x = 2, so the maximum value is 2.
06:58:43
AI Öğretmen
Think of it this way: if you climb a hill, the maximum height is a number (like 2 meters), not the distance along the path where you walk flat. The flat part just shows the function doesn't go higher than that.
06:58:44
AI Öğretmen
A common misconception is mixing up the interval where the function is constant with the maximum value itself. The interval tells us where the function holds the same value, but the maximum value is the actual highest output on the graph.
06:58:45
AI Öğretmen
For example, if a function is constant at y = 5 from x = 1 to 3, the maximum value is 5, not the interval [1, 3].
06:58:46
AI Öğretmen
Therefore, the correct answer for the maximum value of the function should be 2.
06:58:46
AI Öğretmen
Should we continue with the lecture?
06:59:43
Öğrenci
Alright, let's continue
06:59:44
💭 AI Öğretmen
Continuing with the explanation
06:59:52
AI Öğretmen
In this lesson, we discussed how to read graphs from left to right to understand a function's behavior, including identifying increasing and decreasing intervals. We also learned how to find the maximum value of a function by locating the highest point on its graph. Do you have any questions about these topics? If not, we can wrap up the session.